
With any dataset, there are times we need to derive information about subsets of data grouped by some common factor. For instance, in our LaRusso Autos app, we may be interested in the following:
- Number of Sale Vehicles in stock per Manufacturer
- Total Stock Value of Sale Vehicles in stock per Manufacturer
To obtain this information, we will define Rollup columns to aggregate this values up to the Manufacturer table. From our solution view, click Tables > Manufacturer > Columns in the side navigation, and then + New column in the top ribbon.
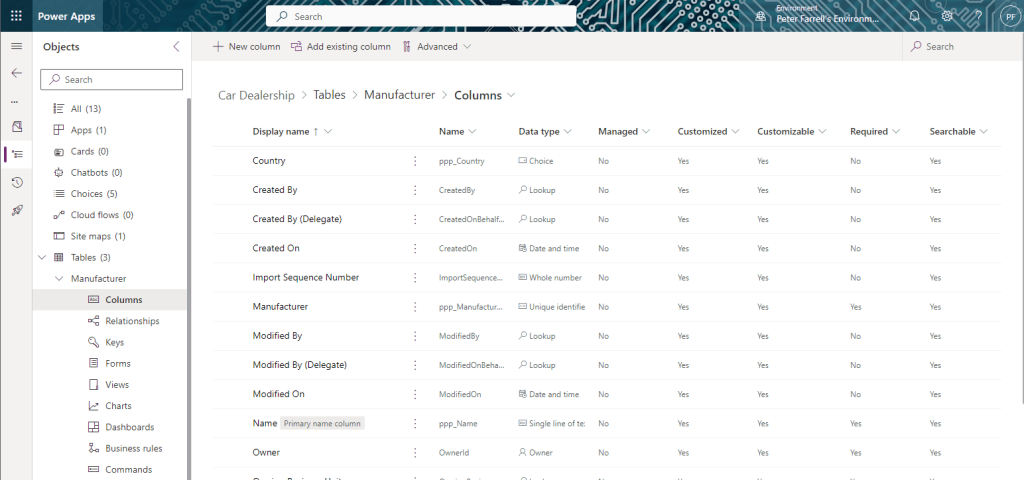
Let’s begin with the total number of Vehicles per Manufacturer and complete the side dialog as follows:
- Display name: Stock
- Data type: Whole number
- Format: None
- Behavior: Rollup

Click Save and edit. If the dialog closes, reopen it again and click Edit. You should get the following popup window (beware of popup blockers in your browser).
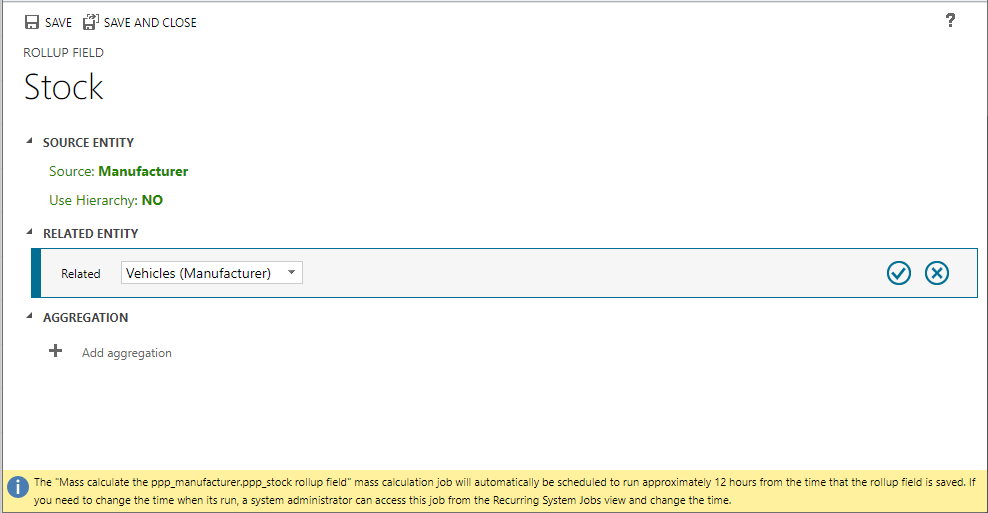
Select Related Entity as Vehicles (Manufacturer) and click the blue tick icon.
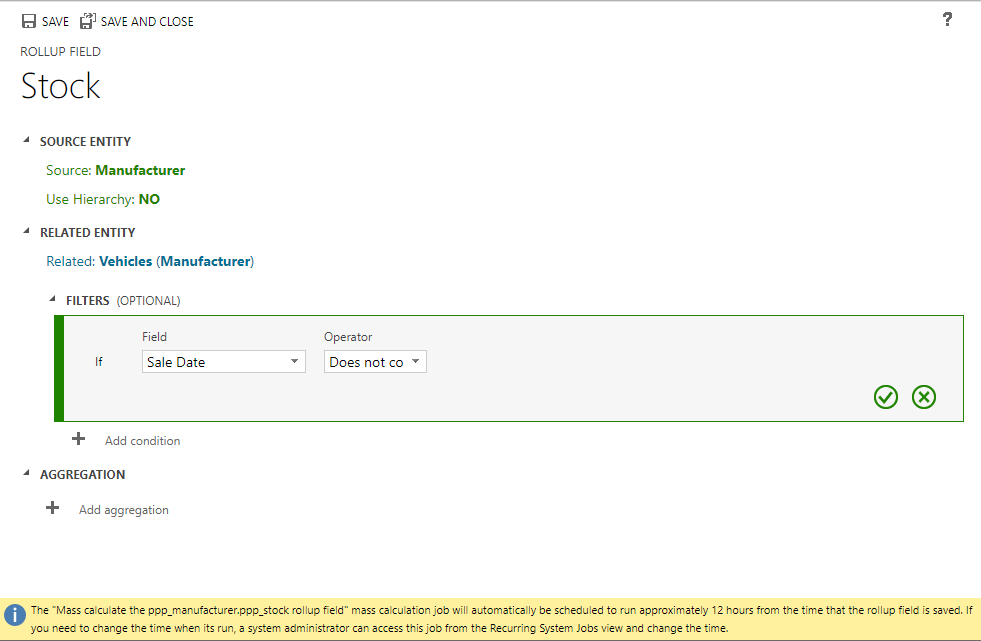
Next we add filters – Sale Date Does not contain data (click the green tick).

And Status Equals Active (click the green tick).
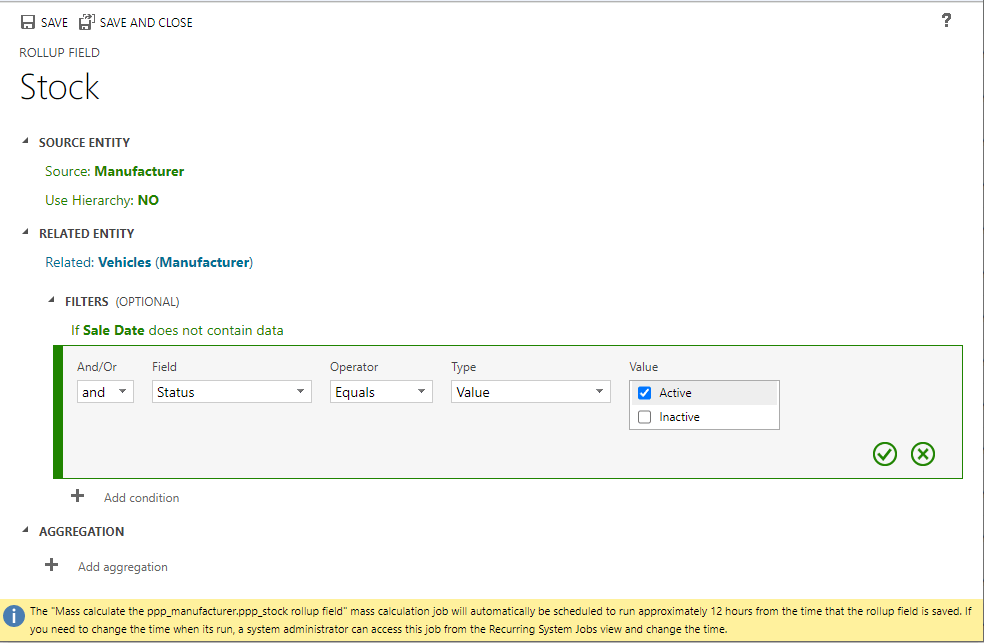
Lastly, we click + Add aggregation
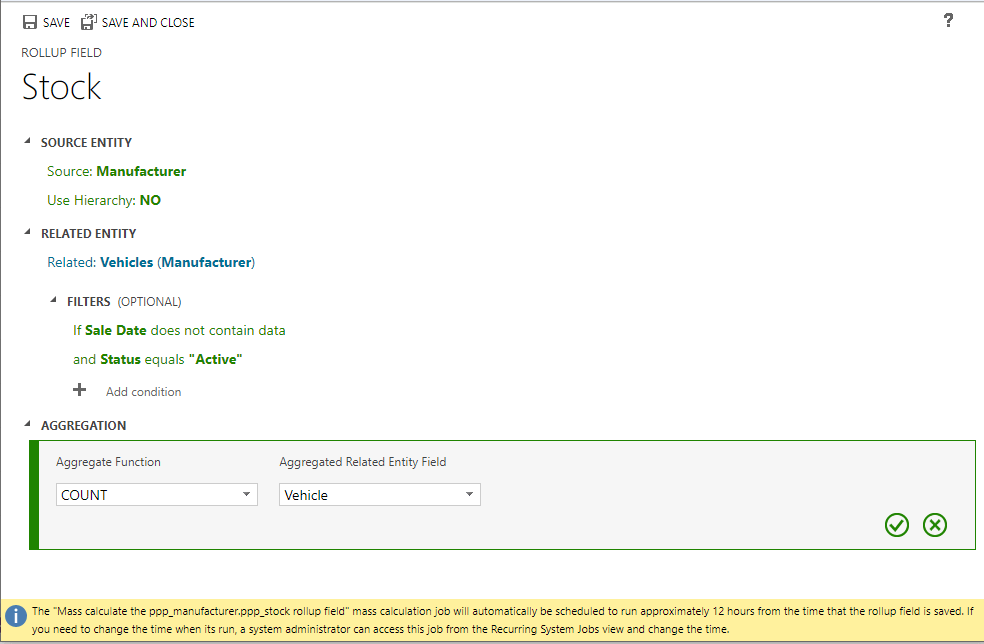
Our aggregation here is COUNT Vehicle. Click on the green tick and then Save and Close.

Leave a comment